No Chasing Data
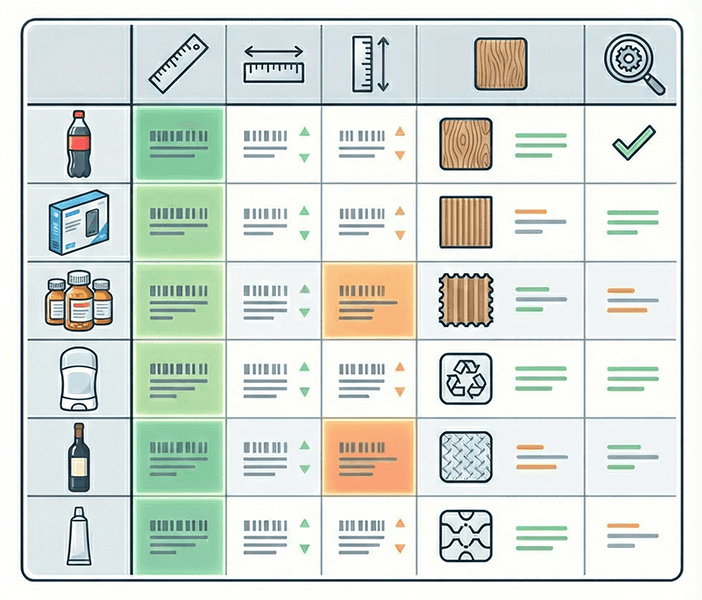
Upload spreadsheets -> Instantly identify incomplete SKUs -> List out missing datapoints
No Wasted Hours
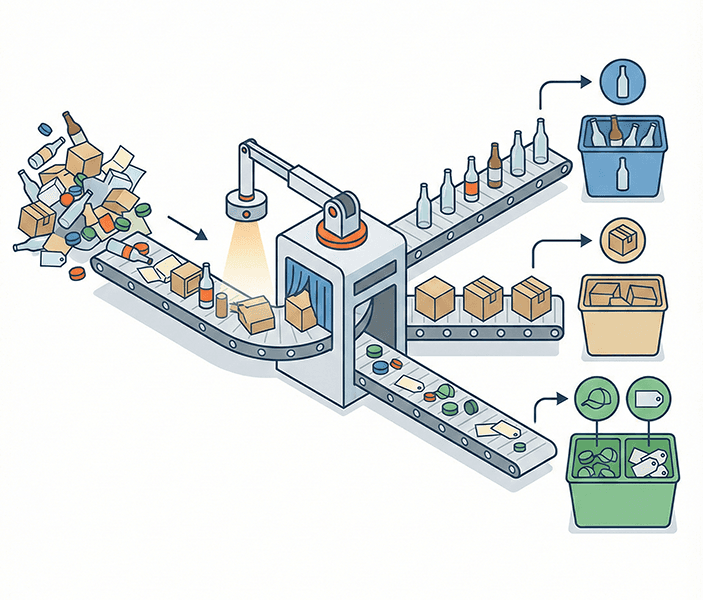
Auto-categorize the easy data -> Focus manual effort on nuanced classification decisions
No Audit Nightmare
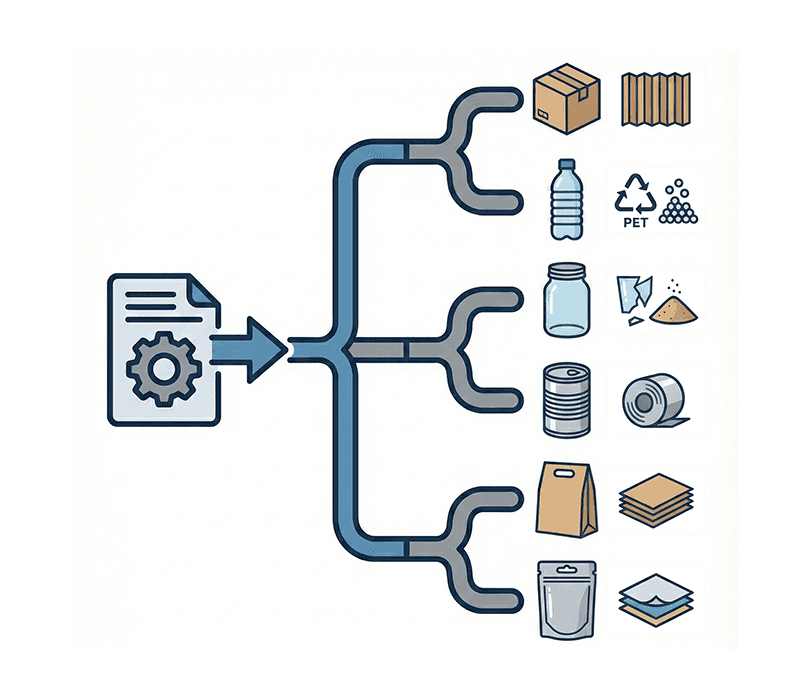
Export report methodology -> See the entire decision tree, for each classification
We love a challenge!
Bring your messiest dataset to a 15-min demo to process it in real time.
The Problem
compliance sucks
We understand why EPR compliance can be a nightmare. Our AI tools are here to reduce your reporting obligation to an afterthought.
Fragmented Data
Distribution data, packaging data, and 50+ global regions

Moving Targets
Evolving regulations and region-specific categories & fees

High Risk, No Reward
Misclassifications can swing fees up (or down) $100,000+
The Solution
Where we come in


Enterprise Plans: Manage distribution volumes, PRO-specific fee schedules, and estimate fees across different filing strategies.
Pricing
Unbelievable Pricing
Only pay for what you need - starting at just 99¢/SKU
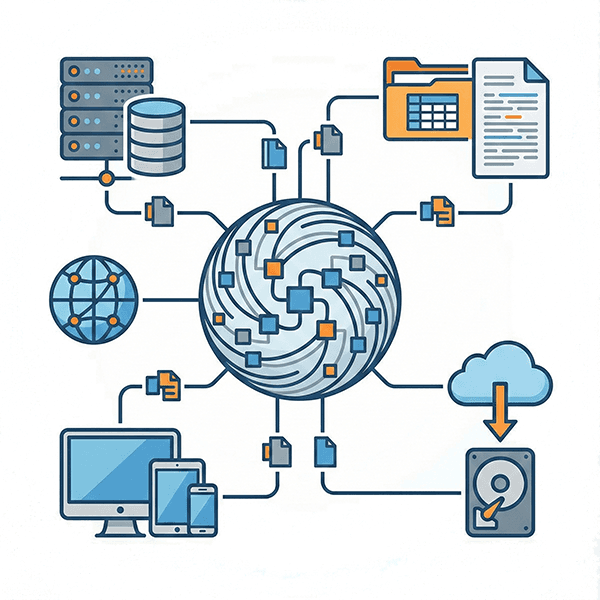
Integrations
Works with tools you already use
Our Unified Integrations Layer lets us quickly stand up custom integrations with your favorite apps, so we fit like a glove into your existing workflow. Turnaround in under 7 days.